
My Splunk Journey: Turning Data Chaos into Security Insights

When I first cracked open Splunk, I’ll be honest, it felt like staring into a black hole of data. Millions of logs, endless events, strange codes flying across the screen. But the deeper I dug, the more I realized: Splunk isn’t just about handling logs, it’s about telling stories hidden inside data.
As someone growing into cybersecurity, this was huge for me. Logs aren’t just boring system outputs. They’re breadcrumbs. Each one is a clue that, when pieced together, reveals what’s really happening inside a network, from normal user activity to stealthy hacker moves. And Splunk gave me the lens to see all of that clearly.
What Splunk Really Is
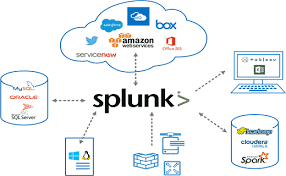
Think of Splunk as a massive search engine for IT data. Just like you Google something and instantly get results, Splunk lets you Google your IT environment. Whether it’s firewall logs, Windows events, or cloud API calls, Splunk can grab it all, index it, and make it searchable.
But here’s the kicker: Splunk doesn’t just stop at search. It helps you analyze trends, detect anomalies, and visualize activity, which is exactly what makes it such a powerful SIEM (Security Information and Event Management) tool.
Instead of being lost in raw log noise, you can zoom in on “Why is this system reaching out to a weird IP?” or “Who’s logging into multiple servers at the same time?” That’s detective work powered by data.
Breaking Down the Splunk Architecture
The more I learned about Splunk’s inner workings, the more it clicked. Each part has a job, and together they form a smooth pipeline for data collection and analysis.
- Forwarders – These are like data couriers.
-
- Universal Forwarder (UF): Think of it as a mailman, just picking up data and dropping it off.
- Heavy Forwarder (HF): Smarter than the UF — it can pre-sort and filter the mail before sending it.
- HTTP Event Collector (HEC): Instead of mail, apps send their data directly via API — fast and clean.
- Indexers – These are the librarians. They take all the raw data, organize it, and file it neatly so you can find it later.
- Search Heads – These are the detectives. They run the investigations (your searches), build dashboards, and create alerts.
Supporting players like Deployment Server, Cluster Master, and License Master help keep everything in sync, scalable, and compliant.
To simplify: Forwarders collect → Indexers process & store → Search Heads let us investigate.
It’s like a crime drama, data is evidence, Splunk is the forensics lab, and SPL is how we crack the case.
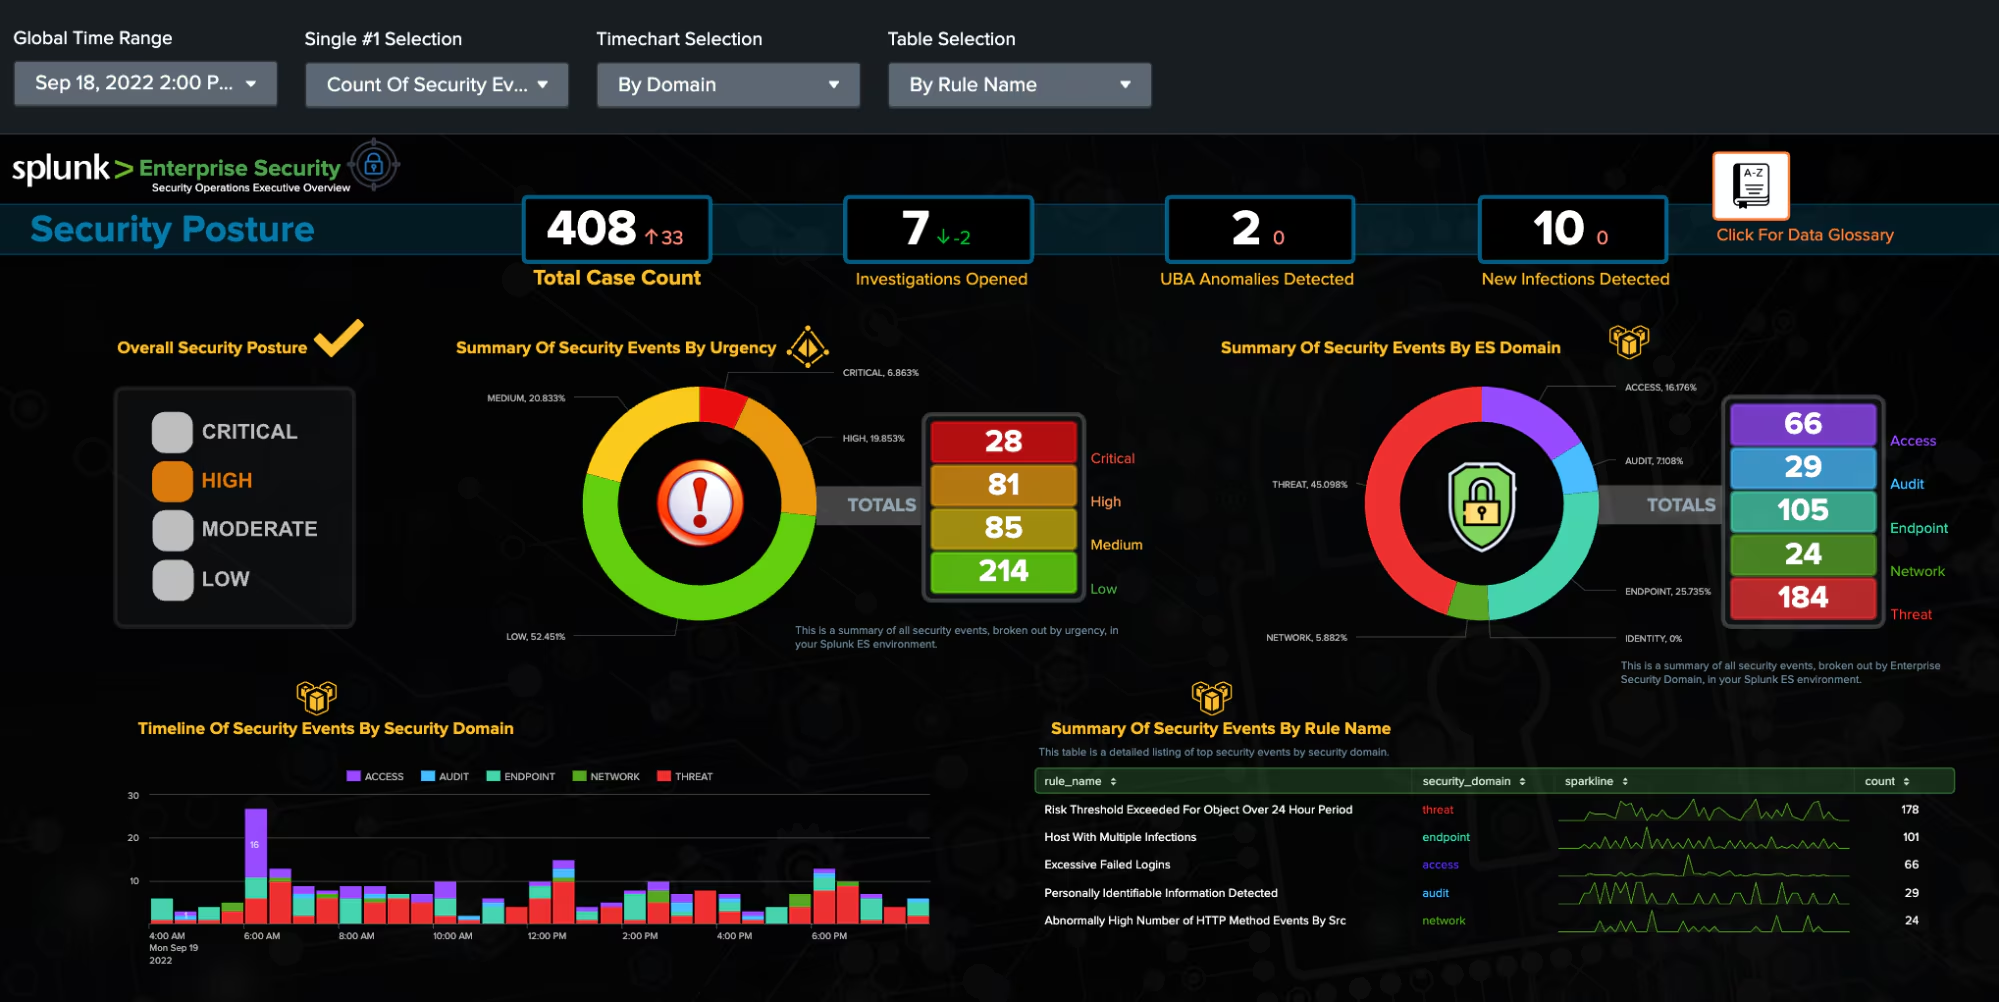
Splunk as a SIEM: Where Security Comes Alive
Here’s where my passion really kicked in: Splunk isn’t just a tool for IT ops, it’s a security analyst’s playground.
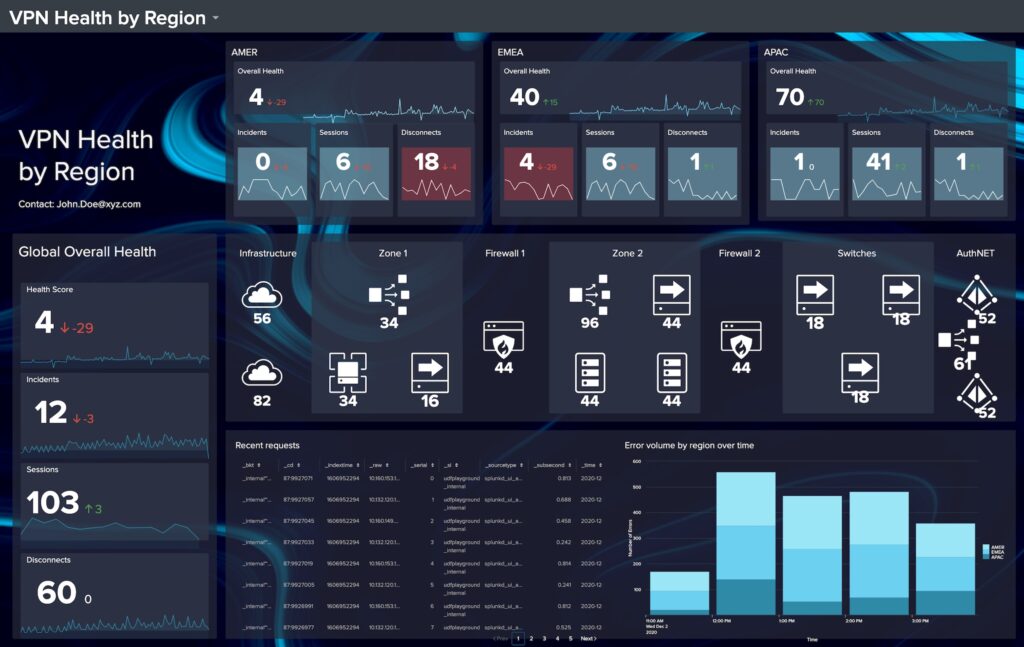
By pulling logs from servers, endpoints, firewalls, and cloud services, Splunk creates a unified view of what’s happening in an environment. This means:
- If a hacker tries brute-forcing accounts → you can spot the repeated login failures.
- If malware spreads laterally → you can trace unusual authentication patterns.
- If sensitive data leaks → you can follow the trail of unusual downloads or transfers.
It turns Splunk into a real-time radar for threats. That’s not just cool — that’s mission-critical.
The Magic of SPL (Search Processing Language)
At the heart of Splunk is SPL. At first, it looked intimidating — dozens of commands, pipes, filters. But the more I practiced, the more I realized SPL is like having superpowers.
Some examples that really opened my eyes:
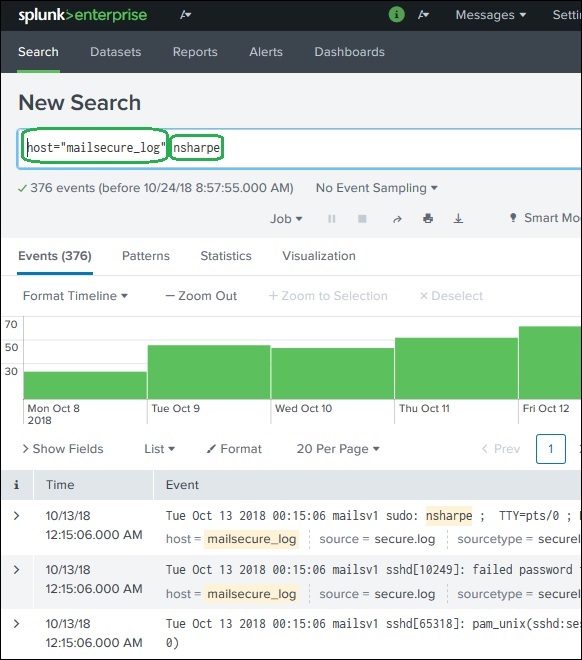
- Simple keyword search:
- index=”main” “UNKNOWN”
Finds every event mentioning “UNKNOWN” in the main index. Boom, instant visibility.
- Excluding noise:
- index=”main” EventCode!=1
Filters out unimportant events so you can focus on the real stuff.
- Making clean tables:
- index=”main” sourcetype=”WinEventLog:Security” | table _time, user, src_ip, EventCode
Instead of messy logs, you get a neat timeline of who did what, when, and from where.
- Analytics with stats:
- index=”main” EventCode=4624 | stats count by user
Shows which users logged in the most, which is perfect for spotting anomalies.
Suddenly, logs stopped looking like gibberish and started telling me stories. SPL is how you turn raw machine noise into actionable intelligence.
Finding the Right Data (Fields & Sources)
One of the best lessons I learned was: before you can hunt, you need to know your environment.
Splunk makes it possible to explore what data you actually have:
- | eventcount summarize=false index=* | table index → shows all indexes. | metadata type=sourcetypes → reveals the sourcetypes available.
- sourcetype=”WinEventLog:Security” | fieldsummary → gives a breakdown of all fields, their values, and how often they appear.
The Splunk UI also highlights interesting fields, helping you spot the data points that matter most.
Once I got this down, hunting felt less like guessing and more like detective work with a solid map.
What Splunk Taught Me
Looking back, here’s what I really took away:
- Data is power. if you know how to search it. Without SPL, logs are noise. With SPL, they’re a story.
- Architecture matters. Understanding forwarders, indexers, and search heads gave me confidence to picture how Splunk scales in the real world.
- Threat hunting is an art. It’s not just writing queries — it’s asking the right questions, spotting patterns, and connecting dots others might miss.
Resources That Helped Me
Final Thoughts
For me, learning Splunk wasn’t just about getting familiar with a tool, it was about discovering a mindset. Splunk taught me that logs aren’t boring; they’re living, breathing evidence of what’s happening across a system.
It’s like standing in a dark room with a flashlight. Without Splunk, you’re bumping into things blindly. With Splunk and SPL, you shine light into every corner and suddenly the whole room makes sense.
This is just the beginning of my Splunk journey, but I’m fired up to keep pushing further, building more advanced searches, designing dashboards, and hunting down threats. Because once you realize that every log tells a story, you can’t help but want to uncover them all.

Threat Intelligence Fundamentals — My Learning Journey with HTB my first real step into CTI As a cybersecurity student, I’ve…
When I first got into cybersecurity, I thought most of it was about prevention ,building firewalls, patching systems, and running…